Jan 20, 2023
Hello there! 👋
Greetings from San Francisco!
Welcome to the new members who have joined us this week!
Join the fast-growing How They Make Money community to receive weekly insights on business and investing.
Several community members have requested an explainer on basic financial terms.
So we launched a recurring series called 💡 How To Analyze.
You can return to these articles when you are unsure about specific financial concepts or want a refresher. Over time, I’ll cover and explain more complex topics in plain English.
Welcome to the third article of our three-part mini-series on the three primary financial statements that every business owner or investor should know:
Income statement (Profit & Loss): shows a company's revenue and expenses over a specific period, resulting in a net profit or loss.
Balance sheet: shows a company's assets, liabilities, and equity at a specific point in time. It’s a snapshot at the end of a period.
Cash flow statement: shows how a company's activities have affected its cash position over a specific period.
These three documents are like the holy trinity of finance, and understanding them is crucial to making informed decisions about a company.
In this series, we'll break down each financial statement and explain what they're all about. We'll use examples and illustrations to ensure you don't fall asleep at the wheel.
You can find other articles in this series on our website:
Introduction to the cash flow statement
A cash flow statement shows a company's cash inflow and outflow over a period. It's like a checking account for a business, but instead of just showing how much money is coming in and going out, it also shows where that money is coming from and where it's going. This information is crucial for understanding a company's financial health and making informed decisions as an investor or business owner.
We'll go over all the important stuff you need to know:
What’s included in a cash flow statement: cash movements by activity.
Key ratios and metrics: margins, stock buybacks, stock-based compensation.
Types of analysis: Traits and trends to look for.
So grab a cup of coffee (or whatever your drink of choice is), and let's get started!
If you prefer a video format, we just launched a new video series on the How They Make Money YouTube Channel! We’ll cover all financial statements from scratch.
Subscribe to make sure you don’t miss the next videos as they come out weekly.
This article is brought to you by App Economy Portfolio, my real-money portfolio service. Joining App Economy Portfolio gives you access to:
📊 Earnings Reports: Compelling earnings visuals & thesis updates for 70+ stocks, plus a steady flow of research on disruptive tech.
🎯 Actionable Ideas: New stocks on the first of the month, best buys mid-month, and live trade alerts twice a month.
🔐 Live Trade Alerts and Portfolio Tracker: Access to my real-money portfolio, practical spreadsheets, and templates.
👥 Active Community: A network of investors that regularly shares updates, company earnings, innovative ideas, and engaging discussions.

1) What’s included in a cash flow statement
Before we analyze a cash flow statement, it's essential to understand that cash and profit are not the same.
Cash refers to a company's money on hand, while profit is calculated by subtracting all expenses from revenue. A company can have positive cash flow but be unprofitable, and vice versa.
Still confused? Here is a short accounting breakdown:
Revenue and expenses are not always timed in line with cash inflows and outflows because they are recorded in different ways. Revenue is recorded when it is earned, regardless of when the cash is received, and expenses are recorded when they are incurred, regardless of when the cash is paid.
For example:
A company may earn revenue by selling goods on credit. In this case, the revenue is recorded when the goods are sold, but the cash may not be received until later.
On the other hand, a company may purchase goods on credit and pay for them later. In this case, the expenses will be recorded when the goods are received, but the cash will be paid out later.
In addition, some expenses like Depreciation, Amortization, and deferred tax, are non-cash expenses. It means they do not involve any cash outflow at the time of recording, but instead, they reduce the net income (profit).
A cash flow statement shows the actual cash coming in and going out, while an income statement shows the company's profits or losses.
Three sections are included in a cash flow statement: operating activities, investing activities, and financing activities:
Operating activities are the day-to-day activities of a business. This section shows how much cash a company generates after selling products or services and paying for operating expenses, from rent to salaries.
Investing activities include buying or selling long-term assets, such as property and equipment, or securities. This section shows how much cash a company uses to invest in its future growth.
Financing activities are things like issuing new shares or taking out loans. This section shows how much cash a company is raising from investors or borrowing from lenders.
Simple, right?
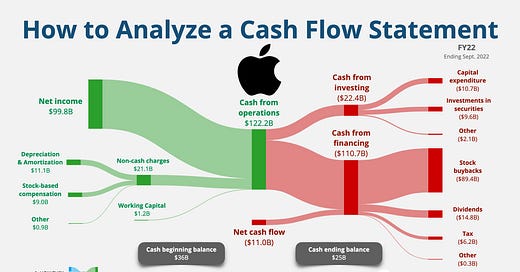
I love using visuals to help us digest financial statements. So as an example, let’s use the largest company in the world, Apple (AAPL), using their cash flow statement for their fiscal year 2022 or “FY22.”
First, you should notice that the cash flow statement starts where the income statement ends: with the net income.
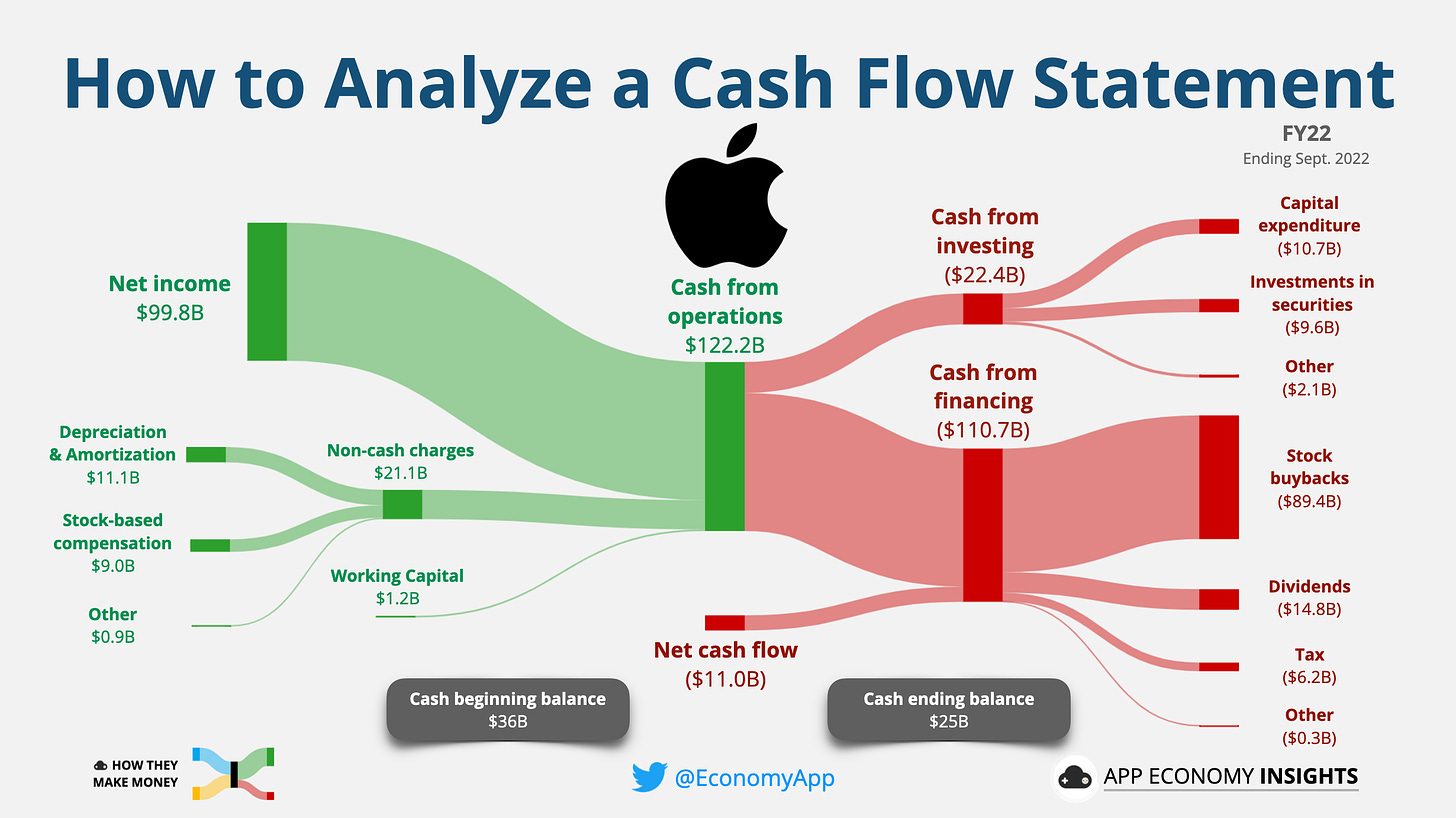
Net income: In the top left, we start where the income statement ended for the period (net profit or net loss). We use the net income as a starting point and add back the non-cash transactions to calculate the operating cash flow.
Cash from operations: In green, I’m showing the adjustments made to calculate the operating cash flow. They can be divided into two categories:
Non-cash charges: they are the expenses that don’t involve any cash outflows.
Changes in working capital refer to the movement of current assets and liabilities over the period.
Cash from investing: In red, I’m showing the net cash used in investing activities.
Cash from financing: In red, I’m showing the net cash used in financing activities.
So here are some of Apple’s FY22 numbers reflected in the visual:
Net profit was $100 billion.
Operating cash flow was $122 billion after removing non-cash expenses.
Apple used:
$22 billion net cash in investing activities: mainly capital expenditure ($11 billion) and investments in securities ($10 billion).
$111 billion net cash in financing activities: mainly returning cash to Apple shareholders via stock buybacks ($89 billion) and dividends ($15 billion).
As a result, the net cash flow for the year was negative ($11 billion).
The company started the fiscal year with $36 billion in cash and ended the year with $25 billion. The difference matches the net cash flow for the period.
Here is the structure of a standard cash flow statement:
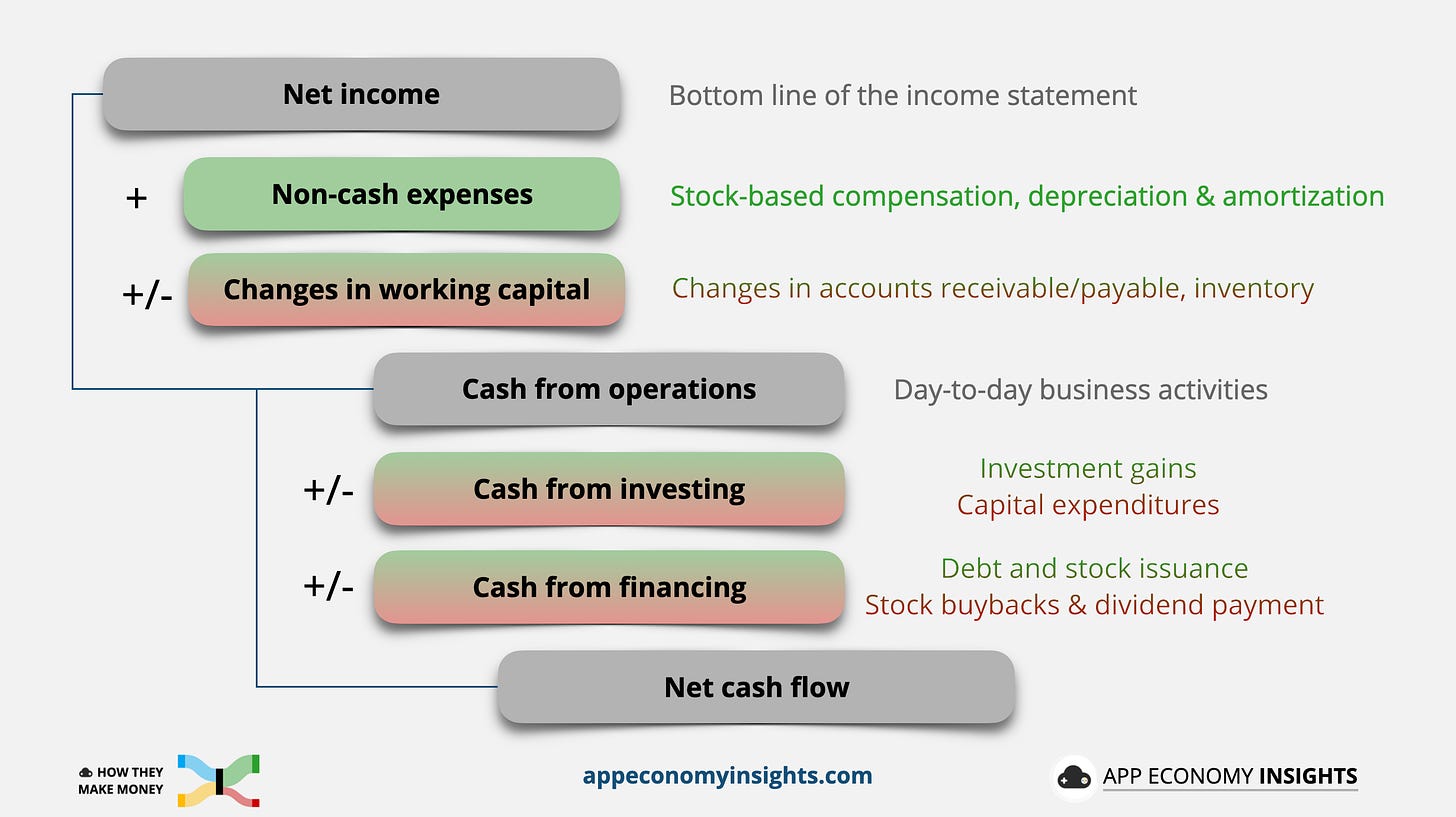
Now that we've covered the basics of a cash flow statement, let’s dive deeper into the three main subsections (operating, investing, and financing activities).
Operating activities
The operating activities section shows the cash transactions to run the day-to-day business. It’s often the most important to review.
A positive operating cash flow is a good sign, as it means the company generates cash just from running its business. On the other hand, a negative operating cash flow can be a red flag, as it means the company is spending more cash on its operations than it's generating.
There are a few key things to look for when analyzing the operating activities section of a cash flow statement:
Stock-based compensation (SBC): SBC is a non-cash expense. SBC is a type of benefit that gives employees the right to acquire company stock at a discounted price or for free. It's a way for companies to attract and retain top talent, and it can be a tax-efficient way for employees to receive a portion of their pay. However, if a company gives its employees stock options, it has to recognize an expense on its income statement for the estimated fair value of those options. The company incurs an expense by issuing equity to employees. This expense is recorded on the income statement as part of cost of revenue or operating expenses. So it reduces the net income but is added back when calculating the operating cash flow. We’ll cover SBC in more detail in a minute.
Depreciation & Amortization (D&A): These are non-cash expenses that a company incurs from using long-term assets, such as buildings, equipment, or patents. In the income statement, they can be spread across COGS (cost of goods sold) and other operating expenses. The cash flow statement is where you can find the exact total amount of Depreciation & Amortization for the period.
When we evaluate a company's overall profitability, it’s critical to focus on the net income since it considers the impact of non-cash expenses like SBC. However, when we focus on the company's ability to meet its financial obligations over time, the operating cash flow is a better indicator.
A negative operating cash flow should prompt you to turn to the balance sheet and evaluate the company's cash and debt. You want to ask how many years it can sustain a business that is bleeding cash.
Investing activities
The investing activities section shows the cash a company uses to invest in its future growth, such as buying or selling long-term assets. That’s where you can identify capital expenditures.
What the heck are capital expenditures, you ask? Here is a short explanation:
Capital expenditures (Capex) refer to the cash outflow from investing activities that a company incurs to acquire or upgrade long-term assets such as property, plant and equipment (PP&E) that are expected to have a useful life of more than one year. These purchases are considered investments in the company's future growth and are typically financed through a combination of debt and equity.
It's important to note that the cash flow statement records the cash that was actually spent during the period in question, while the balance sheet records the assets that were acquired. So, if a company had a large Capex during the period, it will show up in the cash flow statement as cash outflow and the asset will be recorded in the balance sheet.
Note that we deduct Capex from operating cash flow to calculate free cash flow (more on that in a minute).
There are a two key things to look for when analyzing the investing activities section of a cash flow statement:
Purchase or sale of property, plant and equipment (PP&E): These are long-term assets that the company uses to generate revenue. A high level of PP&E purchases can be a good sign, as it means the company is investing in its future growth. Conversely, a high level of sales could be a red flag, as it means the company may be divesting assets. Context is key.
Purchase or sale of investments: These are investments in other companies or assets that the company uses to generate additional income.
Financing activities
The financing activities section shows the cash a company is raising from investors or borrowing from lenders.
There are a few key things to look for when analyzing the financing activities section of a cash flow statement:
Issuance or repayment of debt: A company can borrows money from lenders or pay back money it borrowed from lenders. We want to watch if the company is taking on too much debt, which requires to review the balance sheet.
Issuance or repurchase of equity: A company can sell new shares to raise cash. Alternatively, it can buy back its own shares, which depletes its cash position but lowers the number of outstanding shares, making each share more valuable for existing shareholders.
Dividend payments: A company can distribute a portion of a its profits to its shareholders as a reward for investing in the company.
To wrap up this section, here is an example of a cash flow statement when you open an annual (10-K) or quarterly report (10-Q). This is Apple’s fiscal year ending September 2022 summarized in the visual discussed above. It also includes the comparisons to FY21 and FY20.

2) Key ratios and metrics
When analyzing a cash flow statement, there are several key ratios and metrics that you can look at to get a better understanding of a company's cash flow and liquidity.
Here are a few of the most important ones:
Operating cash flow: Also called net cash from operating activities or net cash from operations. This is calculated by subtracting cash outflows from cash inflows in the operating activities section of the cash flow statement. The operating cash flow margin is expressed in percentage of revenue.
Net income
+ Non-cash expenses
+/- 𝚫 in working capital
= Operating cash flow
Free cash flow: Free cash flow is calculated by subtracting capital expenditures from the operating cash flow. Free cash flow represents the cash a company has available to pay dividends, repurchase stock, pay off debt, or make acquisitions. The free cash flow margin is expressed in percentage of revenue.
Free cash flow = Operating cash flow - Capex
Net cash flow: This is calculated by adding the net cash flow from operating activities, investing activities, and financing activities. It shows the net cash movement for the period. It’s equal to the difference between the starting and the ending cash balance for the period.
Operating cash flow
+/- Net cash from investing activities
+/- Net cash from financing activities
= Net cash flow
= Cash ending balance - Cash starting balance (from balance sheet)
Operating cash flow to total debt: As the name implies, this ratio is calculated by dividing the opearating cash flow by the total debt on the balance sheet. A higher ratio indicates that the company is generating enough cash from its operations to pay off its debt. As explained in our review of the balance sheet, we want to find company that could pay off their debt quickly.
3) Types of analysis
Now that we've looked at each section of a cash flow statement, it's time to put it all together and see the bigger picture.
The traits to look for
When I review a cash flow statement, I focus immediately on a few things:
Positive/improving operating cash flow: This indicates that the company is generating more cash from its operations than it's spending.
Positive/improving free cash flow: This indicates that the company has enough cash available to pay dividends, repurchase stock, pay off debt, or make acquisitions.
Stock based compensation (SBC): SBC is dilutive (more shares are issued to employees). So it’s important to keep an eye on SBC in percentage of the company’s market cap. Ideally, we want to see the free cash flow offset the adverse impact of SBC. It’s also helpful to look at SBC in percentage of revenue. For young tech companies, we want to see SBC go down in percentage of revenue over time.
Stock buybacks: A company can return cash to shareholder via stock buybacks or dividend payments. Stock buybakcs can be extremely beneficial to long-term shareholders. While a dividend payment is a taxable event, stock buybacks return cash to shareholders without generating short-term capital gains. However, a company using its cash to buyback its own shares loses the opportunity to re-invest in growth initiatives. A company should use buybacks aggressively only when its share price is deemed attractive. If the company is still in its growth phase, buybacks might not be the best use of its capital.
Keep in mind that these positive traits are not the only things to look for when analyzing a cash flow statement, it's also important to understand the context of the company's overall financial health, business model, and industry.
For example:
A negative operating cash flow is not the end of the world if the company has a significant net cash position on its balance sheet to fund several years of runway.
A positive operating cash flow is not sufficient if it still comes short of the company’s obligations (interest and debt repayment).
It’s crucial to think beyond the historical data and anticipate how the cash flow could evolve over time. In investing, what matters is the future, not the past. A company’s valuation is based on its future earnings and the cash it can return to shareholders. So you want to keep that in mind. That’s why the market always looks forward.
A great way to illustrate the importance of putting the cash flow statement in context is the case of Netflix (NFLX).
When the company shifted its strategy to original content in 2012 (remember House of Cards?), it dramatically increased its spending.
Development and production costs can be capitalized in the balance sheet and amortized over time in the income statement as the content is released. However, the cash outflows to pay writers, creators, cast, crew salaries and cost associated with building sets and costumes are all hitting the cash flow statement right away. As a result, Netflix saw its operating cash flow turn negative and collapse from 2015 to 2019.
Another factor that contributed to the negative cash flow is the company's international expansion. Netflix was expanding its service to new countries, which required significant investments in content localization, marketing and infrastructure, which also put pressure on the company's cash flow.
While this approach had an adverse effect on cash flow in the short-term, it was a spectacular long-term strategy to drive user acquisition and retention.
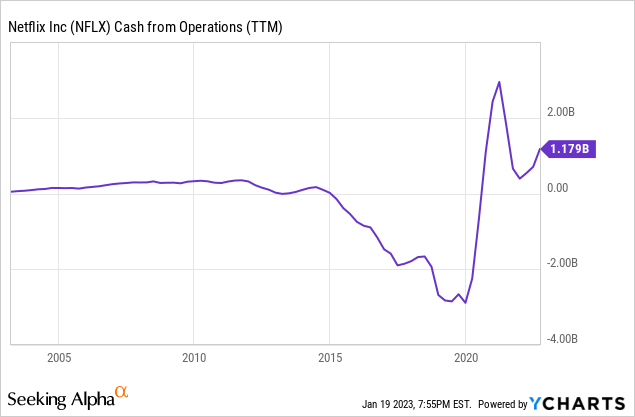
With its extensive catalog, Netflix attracted new subscribers in droves. As a result, the success of this strategy became very clear in the company’s financials.
Today, Netflix has transitioned through the most cash-intensive part of its shift to original content. The company increased significantly its subscription revenue through new paid memberships and price hikes. Netflix has generated positive cash flow since 2020 and has multiplied its revenue by 8x in the past decade.
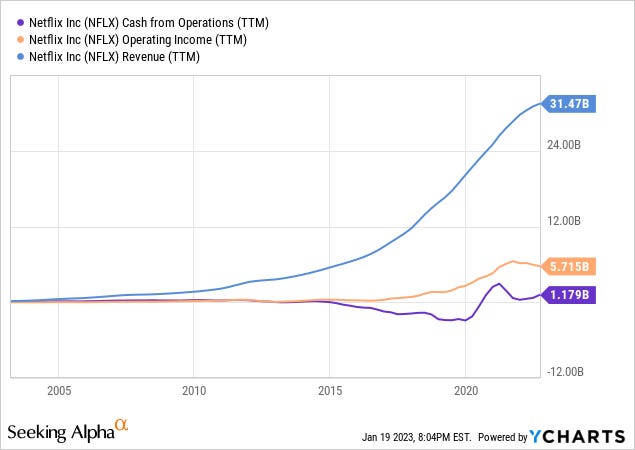
If you invested in Netflix when it released the first season of Stanger Things in 2016 (when operating cash flow was negative and worsening), you would have more than tripled your money today (even in the current bear market).
I hope this serves as a reminder that that it’s critical to zoom out, and think about how a business can elvolve over time.
Final word
Congratulations, you've made it to the end of the article! By now, you should have a solid understanding of analyzing a cash flow statement.
We've covered everything from understanding the different sections of the statement to calculating net cash flow and identifying red flags.
Remember that a cash flow statement is just one piece of the puzzle when it comes to understanding a company's financial health. Be sure to also analyze the company's income statement and balance sheet to get a complete picture.
Keep in mind, financial statements can tell you a lot about the past, but not so much about the future. So we must connect the dots and look beyond the ratios and metrics in the spreadsheet to make good investing decisions.
Andrew Wilkinson talked about the danger of being a “spreadsheet investor.”
Brad Gerstner of Altimeter Capital talked about avoiding the “accountant mindset.” Instead, he wants to embrace an “investor mindset.” One that looks forward, not backward.
Thank you for reading, and we hope you enjoyed this article. If you have any questions or comments, please don't hesitate to reach out.
Stay tuned for more articles to learn about businesses and how they make money.
Until then, happy financial analysis!

Learn more about us directly on our website.
Disclosure: I am long AAPL and NFLX in the App Economy Portfolio. I share my ratings (BUY, SELL or HOLD) with App Economy Portfolio members here.
Discussion about this post
No posts




How to claim
Great post!
So what are some of the reasons apple had gone into a negative cashflow zone to buy back shares? Just curious, as this point from earlier in the article stuck with me.